predictygraph
Predictable graphs. Diagrams as readable text, laid out the way you said, styled with plain CSS.
Tired of AI-generated diagrams that come out as uneditable HTML or XML? Tired of Mermaid rearranging your whole graph when you move one box? predictygraph is a small, line-based language where each group picks its own layout. Change one group and nothing else moves.
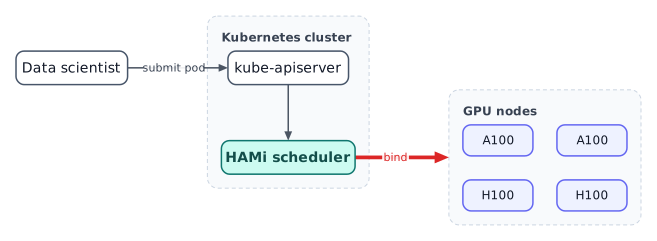
graph dir=LR route=ortho
css "theme.css"

user "Data scientist"
group k8s "Kubernetes cluster" layout=layered dir=TB {
  api "kube-apiserver"
  sched "HAMi scheduler" .hami
  api -> sched
}
group gpus "GPU nodes" layout=grid cols=2 {
  default node .gpu
  g0 "A100"; g1 "A100"; g2 "H100"; g3 "H100"
}
user -> api "submit pod"
sched ==> gpus "bind" .hot
Why
- Readable diffs. One statement per line. No XML, no coordinates.
- Mix layouts. Each box arranges its own contents. Put a grid of servers inside a step-by-step flow, and a circle of nodes inside that grid.
- Plain CSS. A documented CSS subset, resolved by the tool. No browser, no JavaScript.
- Same input, same picture. Deterministic SVG that looks the same in every viewer.
- Animated when you want it. Flowing edges and animated borders, as SVG or APNG.
Install
pip install predictygraph            # or: uv tool install predictygraph
pdg diagram.pdg                      # -> diagram.svg
pdg is the short alias of the predictygraph command. Continue with
Getting started.